Why We Built VedaCharts
The backstory: why existing charting tools weren't solving the problem we had, and the design principles behind what we built instead.
This is a story about a spreadsheet.
A few years ago, one of us was trading discretionary swing setups across about 40 names. The process was: pull up charts in TradingView, eyeball the daily trend, flip to the hourly, check the 15-minute, write down "BUY / SELL / flat" in a Google sheet, repeat. It worked — but it took an hour every morning. An hour that came out of either sleep or coffee.
The design principles
When we started building VedaCharts, we wrote down three rules:
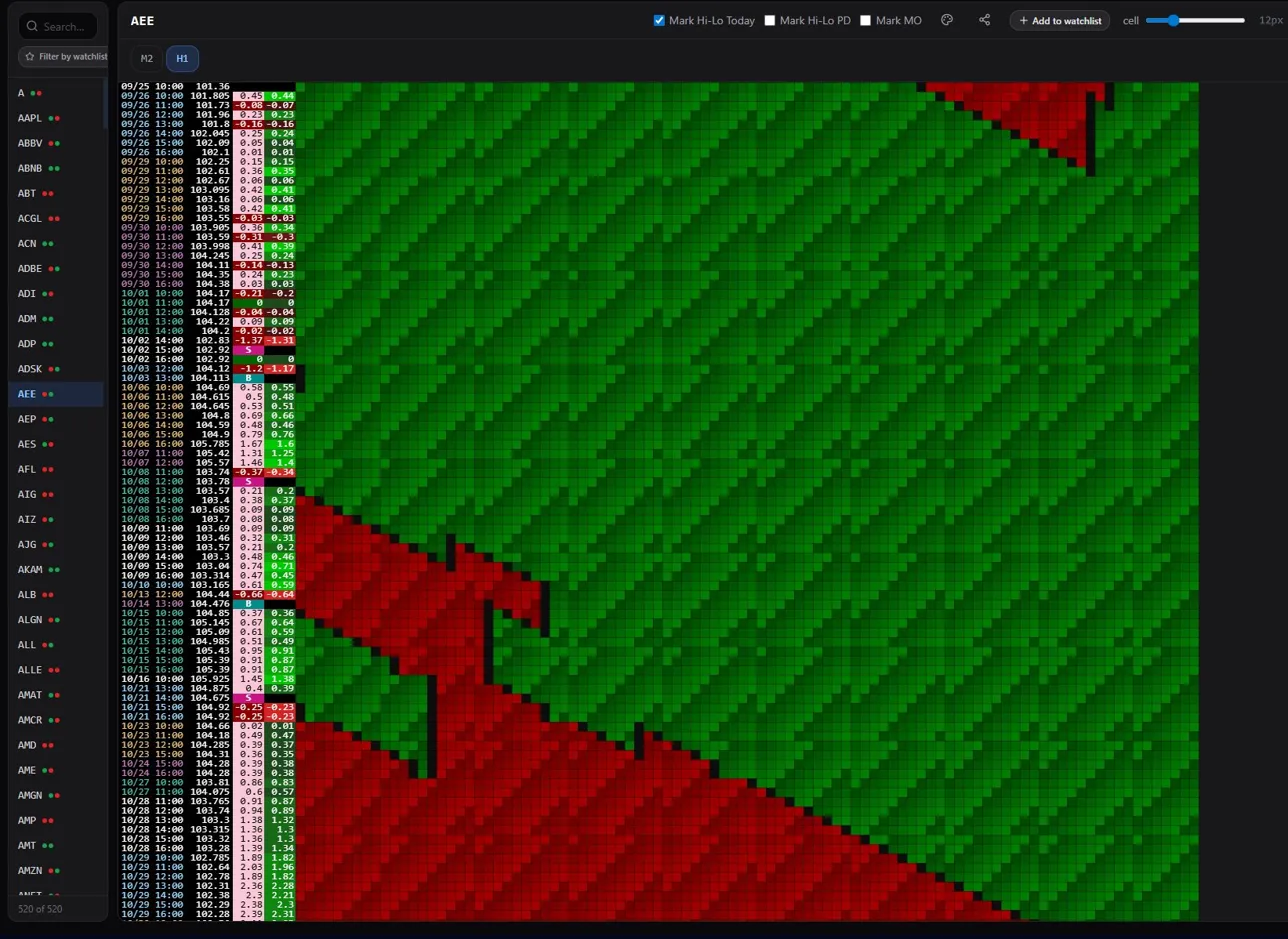
No indicator soup — the chart should be readable at a glance.
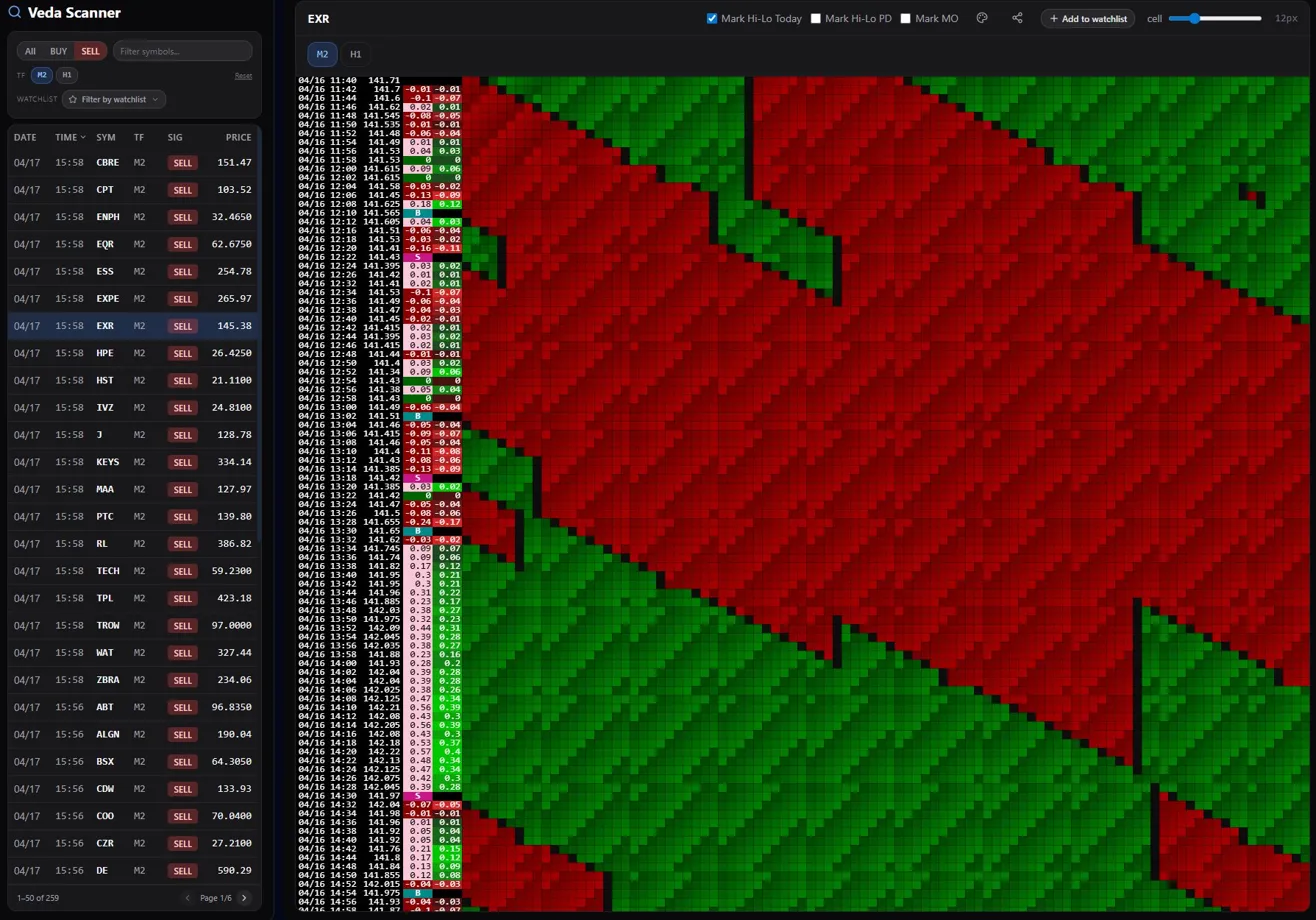
Signals should be explicit, not implied — BUY or SELL, not "well, MACD is crossing and RSI is..."
Multi-timeframe context should be one view, not five.
What changed
The morning routine collapsed from an hour to five minutes. Not because we trade less — we trade more — but because the spreadsheet now fills itself in.
We're not claiming the tool makes trading easy. Trading is hard. But getting the information to your brain in a form that respects your time — that part, we think we solved.
Ready to see every signal before it breaks?
Real-time signal scanning for stocks, forex, futures, and crypto.
Start Your Free Trial →