← Back to Blog
Market Analysis 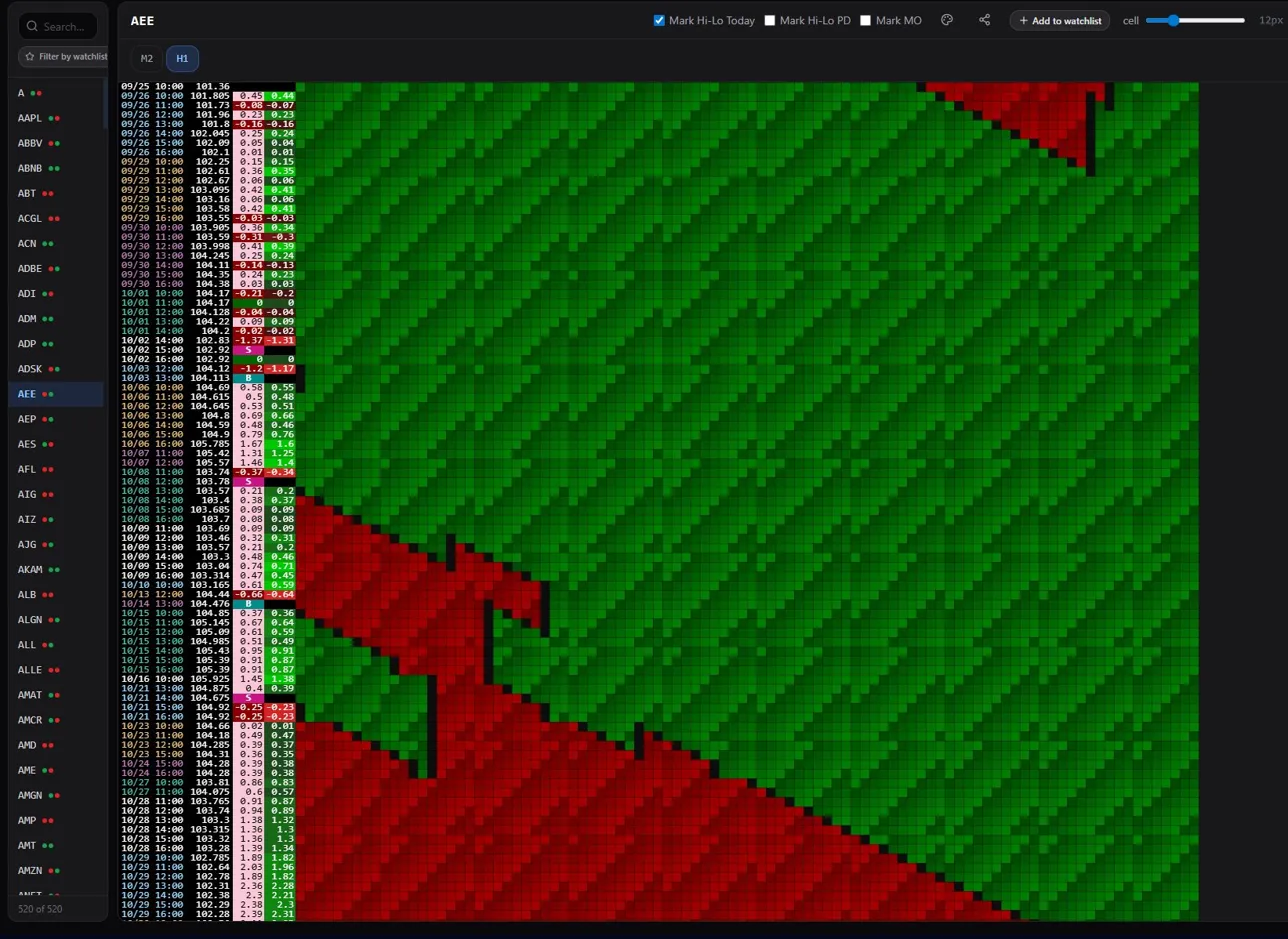
Welcome to VedaCharts
A short introduction to what VedaCharts is, who it is for, and how multi-timeframe scanning fits into a trader's workflow.
VedaCharts Team ·April 20, 2026 · 1 min read
VedaCharts is a signal-first trading platform. Instead of asking you to read indicator soup, we surface clean BUY and SELL setups across every timeframe on one screen.
Built for a specific kind of trader
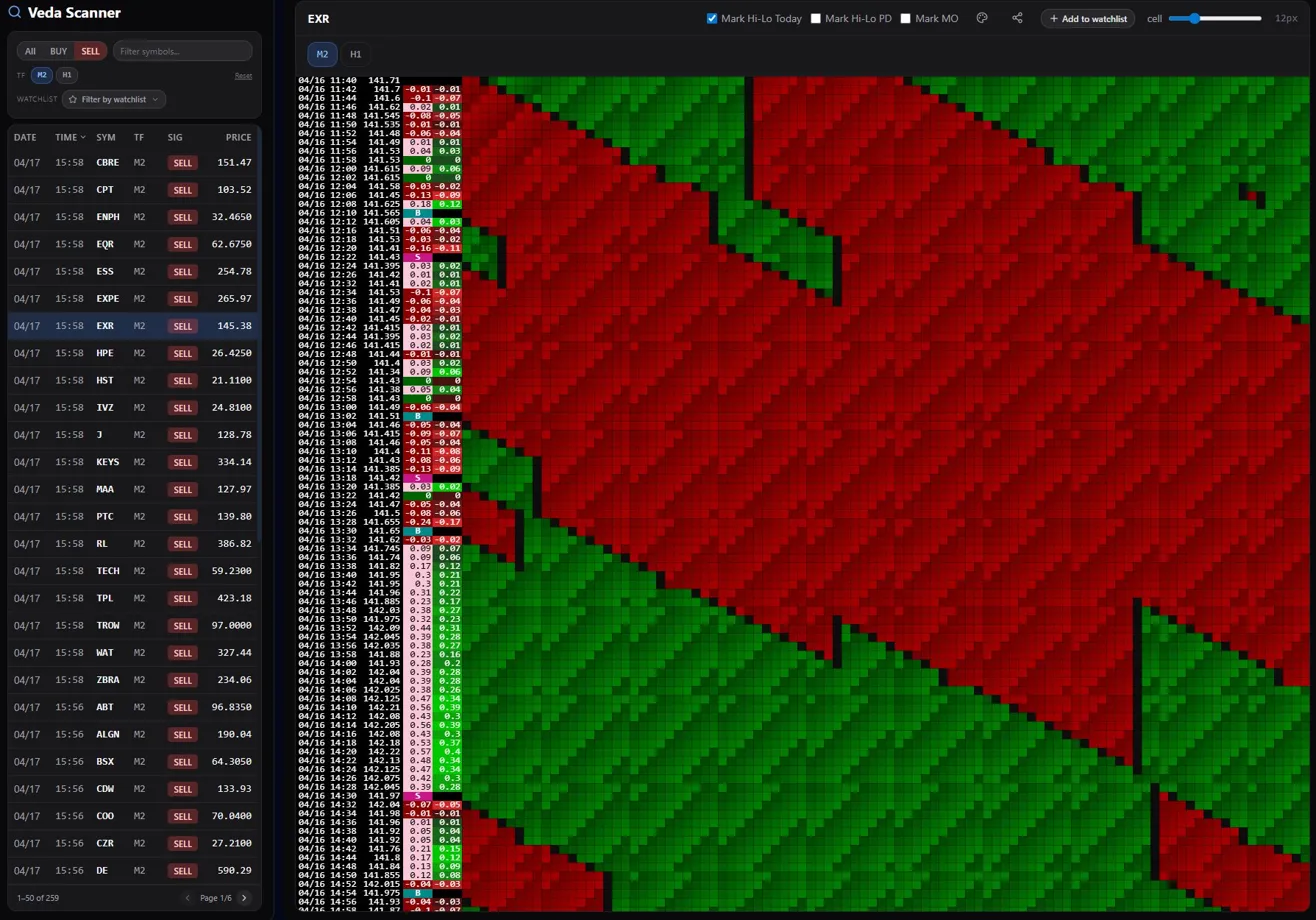
If you've ever flipped through 30 tickers at the open trying to find the one that just triggered, you know the problem. Our scanner was built for that moment. See how multi-timeframe scanning works for a deeper look.
We're actively building. If you want in on the private beta, join the waitlist.
Ready to see every signal before it breaks?
Real-time signal scanning for stocks, forex, futures, and crypto.
Start Your Free Trial →